
Email Marketing Insights in 2025 from Neil Patel
Neil Patel recently shared powerful tips on email marketing success—think cleaner lists, smarter personalization, and value-packed content. His key message? Email isn’t dead; it’s evolving.

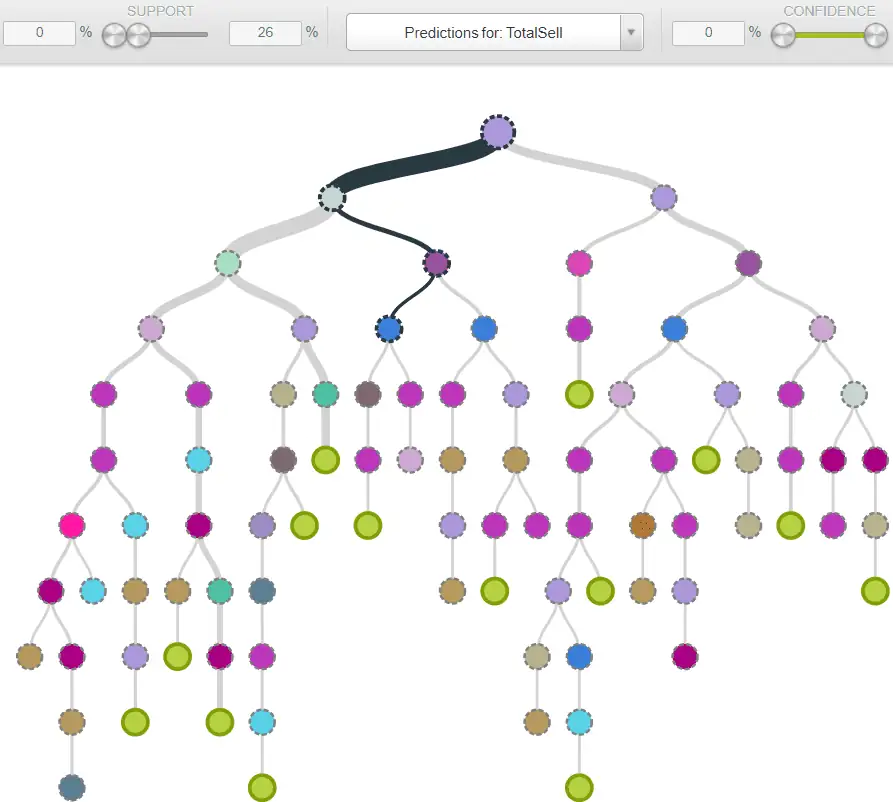
The first thing we did was work out the average sale value over the last 12 months. We discovered this was $200. We then changed our y-value field into a binary metric. Any sale above or equal $200 was classified as 1, any sale below $200 was classified as 0. We changed this from a regression problem into a classification problem. In the next step, we split the data into a training set and a test set. We had ~140,000 rows of sales data, where each row represents an individual sale. 80% of this data would be used to train the model, the remaining 20% would be used to test the model. In the training set we feed all the feature inputs to the model including the y-values (the sales data, ie the answers). The model iterates through each row in the data set and then evaluates its own predictions against the actual answers. For more detail on how this process works and the different models we can use, see an earlier article I wrote about fitting a random forest model to Google Ads data. We perform this training process multiple times for different models. The below screenshot shows one of the decision trees we trained and how it build’s different paths to make decisions.
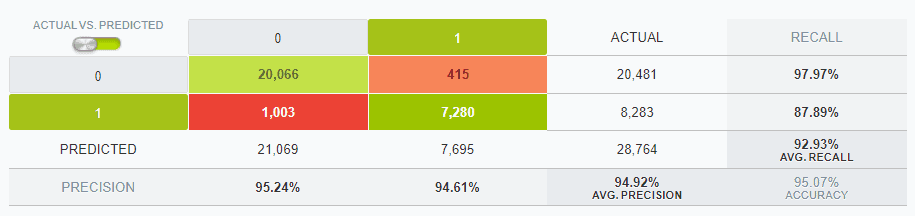
Following this training period we evaluate the models to see how accurate they are on new unseen data. We run the trained model on the test set which contains 20% of the data and we do not include the answers for this test set. After the model makes predictions on the test set, we then compare these to the actual answers. From our best model, we were able to predict with 95% accuracy whether someone would be a high value or low value sale (1 or 0). To put this in context, if we were to assume everyone was a low value sale (0), then we would have predicted correctly 71% of the time (71% accuracy). So we see that 95% accuracy is far better than the mode. Below we see these results in more detail.
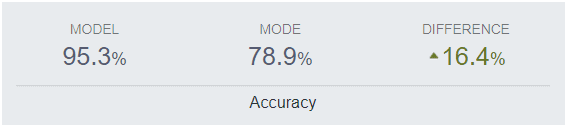
We ran the same model again 1 year later with new client data that had come in over the past year. This dataset had 78,630 new items (sales). We used the complete new data set (100%) as a test set. This was a much larger data set then the previously used 20% test data set which had only 28,764 rows in it. We were expecting to see poorer results, since we thought the model would overfit to the training data & do less well on a larger unseen data set. Surprisingly, the model performed even better on the new data, with an overall accuracy of 95.31%. Below are the detailed results:
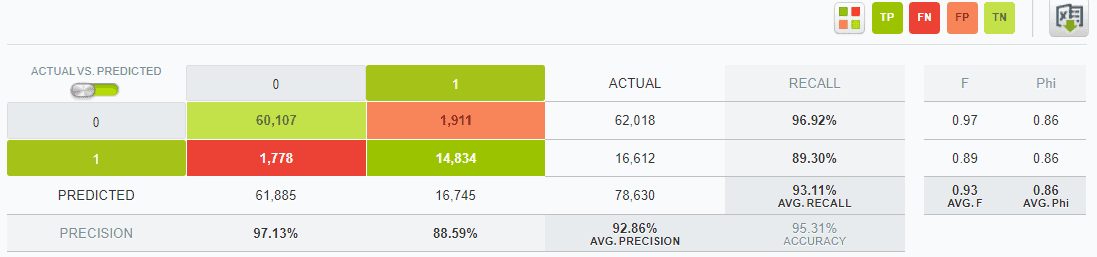
Again, to put this in context, on this new data set, if we would have predicted the mode, (ie predict everything as 0), we would have only 78.9% accuracy. So the model again had significantly better accuracy then the mode.
We now had a trained model that could identify high and low value sales using just a handful of feature inputs. The client was able to use this modelling to decide how to interact better with sales prospects. They can dedicate more resources and time to higher value prospects and also offer discounts and other incentives. Secondly, we were able to look under the hood of our model and identify the key features that were used most as predictors of high/low value sales. We can then apply these key features to improve our clients inbound sales mechanism. Some of the identified features can be used as ‘levers’. A lever is something you can pull or adjust. For example a feature such as ‘product type’ was not a lever, since we cannot determine this selection before the prospect has reached the website. But ‘Age of customer’ and ‘Postcode’ are levers since we can adjust our marketing towards clients of a certain age & who live in a certain region. We have used this knowledge in Google & Facebook Ads to ensure we are dedicating budget to the right age users in the right location.
Neil Patel recently shared powerful tips on email marketing success—think cleaner lists, smarter personalization, and value-packed content. His key message? Email isn’t dead; it’s evolving.

SEO copywriting: user-focused, keyword-rich content. Optimize URLs, titles, and meta descriptions. Balance search engines and audience needs to boost rankings and drive traffic.

Brand owners can control their Amazon listings and remove unauthorized sellers by enrolling in Brand Registry. This grants priority in content updates, access to A+ content, and tools like Brand Transparency and Project Zero.