Should I launch my product on Shopify or Amazon?
Product launch dilemma: Shopify or Amazon? We break down the pros and cons of each, helping you choose the best platform for quick sales vs. long-term brand building.

In a recent post on Marketingland, I described a process to perform regression analysis in Google Ads. By fitting a trend line to daily Cost & Conversion data, we were able to map the relationship between these variables. We could then make predictions about conversions & CPA at different levels of daily ad spend.
The post included a walkthrough into fitting a trendline in excel, with similar output to the example below. Each point represents the Cost & Conversion volume for a particular day. We covered how you can fit a linear or non-linear trend line to map the relationship between cost and conversions.

I received a question from a reader asking how we can fit other prediction models like a Random Forest. In this article, I plan to cover how you can do this. For interested readers, it is a great introduction to the world of data science & machine learning and how this can be applied to digital marketing practice.
Unfortunately, you can’t build a random forest in excel. For this analysis, we need to use python and a python library called scikit learn. I’ve shared my notebook with the python code here via GitHub.
Unlike the previous article, this one won’t be a walkthrough. There are a number of prerequisite steps that would be too lengthy to cover in this article. These are needed to set up a python environment, install jupyter notebook & import relevant libraries. Also to replicate the analysis an understanding of python code is also required. Therefore we will be focusing on the output of the code and exploring the value of different models.
Let’s jump straight into Decision Trees & Random Forests.
Before we build a Random Forest, we should build a decision tree. Random Forests are models that combine many decision trees and then average the result. So it is useful to see how a fitted decision tree looks like first.
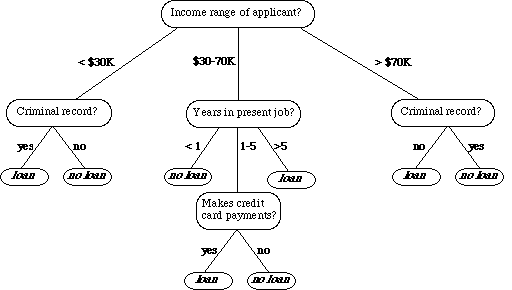
A decision tree is essentially a way of making a sequence of decisions to predict an outcome based on the different independent variables. This is easiest seen in an example.
I’ve taken an example from here, which shows a bank deciding on whether to provide a loan.
A question is asked about an independent variable and then based on the answer, a split occurs narrowing down the decision. This is then repeated with a new question, further narrowing down the decision. You will notice that in this tree it took a maximum of 3 levels of decisions to get to an answer.

The above is an example of a classification problem where the prediction at the end is ‘loan’ or ‘no loan’. But you could imagine the same for regression where the outcome is a number range, for example, the amount to loan someone.
When we fit a decision tree to our Google Ads data the results looked as follows:

Unlike a linear model, the decision tree is able to split the data into groups, this is why you have steps in the trend line. In the image above for example at any cost between 450 & 900 the decision of 6 conversions is the same.
For any model we run we should always measure how accurate our results were. The accuracy of predictions when using a decision tree with a maximum depth of 3 decisions was:
The r-squared value is a statistical measure of how close the line fits all the data points, the closer to 1, the better. The root means squared error (RMSE) measures the error between the predicted values and the actual values. Since it shows us the error of the model, the lower score means a better prediction. I prefer to use the RMSE to evaluate performance in regression.
The above decision tree was limited to 3 levels of decisions. What happens if we let the decision tree make more decisions? This time we ran a decision tree with a depth of 10, the below image shows the decision lines.

The tree was able to make more decisions and closer fit to the data, the steps in the line are smaller. It’s a tighter fit, but it is even more prone to overfitting, which we’ll discuss further on.
The results of this tree were:
The r-squared value was much higher and the error far lower when we provide the tree with more decision levels.
A random forest combines a number of decision trees. By averaging their results it is able to provide a more accurate score and reduce the chances of overfitting.
In the example below we ran a random forest comprised of 20 decision trees

We can already see from the image that the random forest might not go through as many points as a single decision tree, but is far better at predicting trends in the data than any individual tree
The Random Forest had a slightly higher error value the the decision tree 10, in this case on the training data. In my experience, when using a holdout set (unseen data), random forest’s perform far better than any single decision tree.
Combined Results
We’ve also run the same process for linear, & non-linear models and graphed them all together.

We can see above how each model maps the data points to try and represent the relationship between ‘Cost’ & ‘Conversions’. Linear, quadratic and cubic models are able to find a strong continuous relationship between these variables that extends beyond the graph.
The random forest maps the existing data very closely, it is able to go through most of the data points. So it will provide a low error value, but it is not finding the same kind of trend that the other models do.
For example, the quadratic model shows that there is a point of diminishing returns. There will be a point where extra spend will not lead to extra conversions. At around $1,000 in spend the model starts to plateau. The random forest on the other hand has conversions jumping around more frequently. It predicts that maximum conversions occur at about $500. It is difficult to observe a trend in the data with the random forest.
In this case we would likely conclude that the Random Forest is ‘overfitting’ to the existing data. This means that it fits the trained data too well and when tested on unseen data points, It will not make accurate predictions. Error values on new data will likely be higher than other more simple models like linear regression
The quadratic or logarithmic function more accurately predicts the trend and will be able to make better predictions on new data points.
We’ve provided the error values for each model below, but remember, these are only the error values on existing (training data). And therefore only useful on existing data (historical data) The real test would be to run the model on new data and review error values (future data).

As we have seen, the first key issue with Random Forests is that they can be prone to overfitting. They are less prone then Decision Trees, since they average many of them out. Limiting tree depth and increasing the volume of data also helps reduce overfitting.
The second limitation stems from the first, in that the tree does not find a general trend in the data so it cannot be extrapolated beyond the range of data it is mapping. For a linear model or a logarithmic model we can see the trend well beyond the range of data provided and could predict what will happen as cost ‘x’ increases above $1,000. However, Random Forests & Decision trees cannot extrapolate beyond the range of data.
Hopefully this post has provided insight into the value of machine learning techniques and how we can use them in digital marketing. Random Forests can be extremely powerful at making predictions.
Next time we will look at adding more independent variables (‘features’) then just ‘cost’ data. The more input features we have for the algorithm, the better it should be at predicting conversions, since conversions are not based on cost alone.
Another crucial next step is to create a hold out set for validation. Before fitting the model, 20% of the data should be separated out and used for validation purposes to test the accuracy of the model. In this way we can test the predictive strength of the model.

Product launch dilemma: Shopify or Amazon? We break down the pros and cons of each, helping you choose the best platform for quick sales vs. long-term brand building.

Master Amazon cash flow! Learn to calculate your product’s cash cycle, from manufacturing to payout, using Amazon’s “Sell Through Rate.” Get accurate forecasts for smarter scaling.

Neil Patel recently shared powerful tips on email marketing success—think cleaner lists, smarter personalization, and value-packed content. His key message? Email isn’t dead; it’s evolving.
Subscribe to receive exclusive industry
insights & updates
Copyright © 2014 – 2025 One Egg. All rights reserved.
Subscribe to receive exclusive industry insights & updates