
Lawyer PPC Mistakes: 7 Expert Ways Your Firm Is Bleeding Budget
How much does Google Ads cost for lawyers in 2026? View CPC & CPL benchmarks for Personal Injury, Family Law, & more. Slash costs with our 2026 PPC audit.


The advantages of dynamic dashboards are many, let’s lay them out:
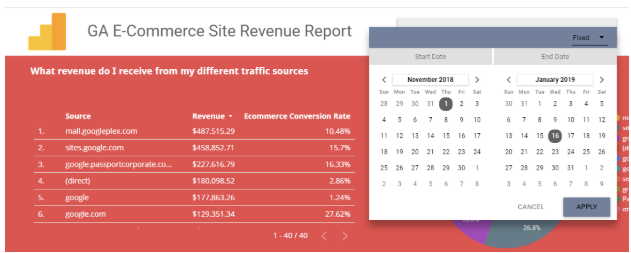
Real Time Reporting: Unlike static monthly reports, that are generated at the end of each month, Google Looker Studio provides real time reporting. Some data sources are refreshed every 15 minutes, others are longer, but the lag is not more than 12 hours for most sources. Report dates can be adjusted on the fly, allowing you to view the previous month or any time period you like.
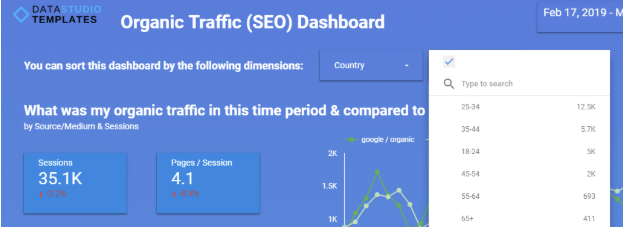
Interactivity: GLS dashboards are interactive. Aside from dynamic timeframes, you can also setup the report to filter by dimensions. With the click of a button you can adjust all graphs and tables to only show traffic filtered by devices or traffic sources. The viewer has the ability to interact with the dashboard and drill down to what they are interested in. In this clickable example Google shows how interactive charts work. In the below dashboard screenshot you can see a filter for ‘age groups’
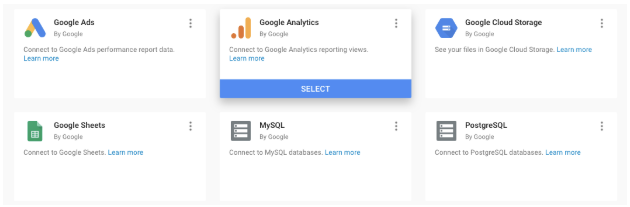
GLS is the ability to connect your data sources to premade templates. As an agency this is particularly great, as you can create one template and duplicate it for multiple clients. Each clients template is then connected to their own data sources. While static tools also often come with templates, since GLS is free and open to the market, there is a wide 3rd party user base creating and sharing their own templates.
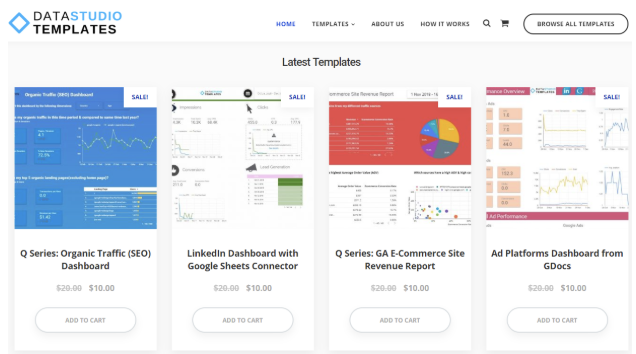
A great example is a site I’m affiliated with, datastudiotemplates.com. They currently offer over 50 templates at a low cost covering all types of digital marketing activity. More are coming out all the time. The below screenshot shows some of the latest templates on the site.
Pricing: Being a Google product, GLS is free to use. Many of the static reporting tools are costly. For any Google product integration with GLS you don’t need 3rd parties and using GLS is free. But if you want to integrate other non-Google data sources, often these come out a cost.
3rd Party Connectors: While 3rd party connectors cost money, they provide added useability, allowing you to connect GLS to a wide variety of platforms. GLS has over 100 connectors available at the time of writing
Shareability: A static report is usually sent as a PDF or an excel file by way of email. GLS provides far more options. Beyond generating a PDF, it can be shared via a link & it can be password protected. It can also be embedded on your website, which is perfect for agencies wanting a professional look. Here’s an example of an embedded dashboard on my agency site. This is a great way to have clients coming back to your site and seeing your capabilities.
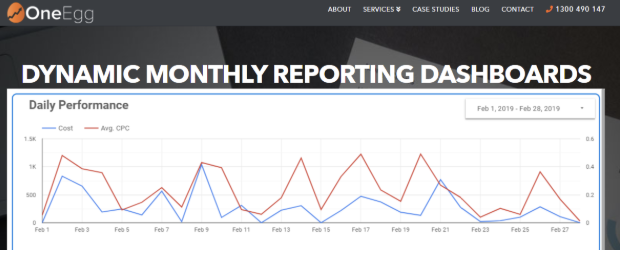
Transparency for clients: When a client is able to check in whenever he or she wants, this gives them a greater sense of transparency into the work being done. It also gives them a greater sense of control that they know where and how their budgets are being spent. This ultimately means happier and less worried clients.
Time savings for marketers: While dashboards look like a lot of work, they actually reduce work. The ability to template your work and share between multiple clients saves buckets of time. The abundance of free & low cost templates available saves you from developing your own new reports. The sharing options also means time is saved on sending, tracking & following up emails every month.
It’s difficult to see how a dynamic dashboard is inferior to a static report. Some agencies run static reporting in excel which might have certain flexibilities in data calculations. But this can usually be performed in GLS and the cons of excel far outweigh the cons of not using an online dashboard.
The main issues that are brought up in conversation around GLS are it’s limitations compared to other Business Intelligence (BI) Tools. Other BI Tools tend to have key features where GLS is still behind in the industry.
Data preparation & blended data is one area where GLS still needs to improve. The other is including a better content management system (CMS) to make content handling smoother. However, this is a whole topic in and of itself. For digital marketing reporting purposes & especially those that want to get up and running quickly & easily, GLS is still the best go to tool in the market.
I’ve spent many hours building templates with GLS and I’ve identified the process consists of three key components:
It is in the design where most of the time is spent. For this reason, using low cost templates is a fantastic feature of GLS, it saves countless hours. It means you don’t have to reinvent the wheel and takes the tediousness out of reporting
I strongly recommend working with a template. Often there are templates that match your requirements exactly. Other times, these can be adjusted to add extra graphs or metrics. Since the design is already there, the adjustments are fast and enable you to get going very quickly. Build on the work that has already been done by others.
When moving from a static report, search out GLS templates that offer similar information and migrate your reporting online! You & your clients will be happier.
How much does Google Ads cost for lawyers in 2026? View CPC & CPL benchmarks for Personal Injury, Family Law, & more. Slash costs with our 2026 PPC audit.

How much does Google Ads cost for lawyers in 2026? View CPC & CPL benchmarks for Personal Injury, Family Law, & more. Slash costs with our 2026 PPC audit.

How much does Google Ads cost for lawyers in 2026? View CPC & CPL benchmarks for Personal Injury, Family Law, & more. Slash costs with our 2026 PPC audit.